CSS – Bar grafiek
![]()
Ik had het idee om een “dynamische” grafische Grafiek (Bar) te gebruiken met maar liefst 1 bestand om in te laden, die tevens compatibel is met alle browsers en mobiele apparaten, en dit te gebruiken op een Arduino Ethernet Shield, jQuery en Bootstrap zijn daarmee te zwaar om te laden via de Arduino (veel code nodig om de cascade aan bestanden te laden vanaf de SD kaart)
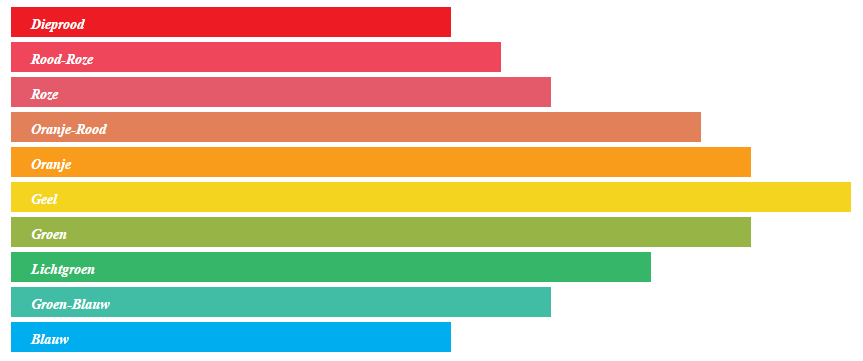
Dus kwam ik op het idee om een CSS script te gebruiken, na wat googlen stuitte ik op deze simpele CSS Bar.
Voor mijn eigen voorbeeld heb ik de code aangepast en de waarden van de Bars uit de CSS gehaald en in de HTML opbouw gestopt, op deze manier hoef je maar 1 keer het CSS bestand in te laden en via een microcontroller kun je de waarden in de HTML opbouw stoppen.
Het CSS bestand (voor kleuren en vormgeving):
|
1 2 3 4 5 6 7 8 9 10 11 12 13 14 15 16 17 18 19 20 21 22 23 24 25 26 27 28 29 30 31 32 33 34 35 36 37 38 39 40 41 42 43 44 45 46 47 48 49 50 51 52 53 54 55 56 |
.bargraph { list-style: none; padding-top: 20px; } ul.bargraph li { height: 30px; color: white; text-align: left; font-style: italic; font-weight: bolder; font-size: 14px; line-height: 35px; padding: 0px 20px; margin-bottom: 5px; } ul.bargraph li.dieprood { background: #ED1C24; } ul.bargraph li.roodroze { background: #EF465B; } ul.bargraph li.roze { background: #E55A6B; } ul.bargraph li.oranjerood { background: #E28159; } ul.bargraph li.oranje { background: #F99C1C; } ul.bargraph li.geel { background: #F4D41E; } ul.bargraph li.groen { background: #97B546; } ul.bargraph li.lichtgroen { background: #36B669; } ul.bargraph li.groenblauw { background: #42BDA5; } ul.bargraph li.blauw { background: #00AEEF; } |
Het HTML bestand:
|
1 2 3 4 5 6 7 8 9 10 11 12 13 14 15 16 17 |
<head> <link rel="stylesheet" type="text/css" href="CSS Bar voorbeeld.css"> </head> <html> <ul class="bargraph" style="width: 800px" > <li class="dieprood" style="width: 400px">Dieprood</li> <li class="roodroze" Style="width: 450px">Rood-Roze</li> <li class="roze" style="width: 500px">Roze</li> <li class="oranjerood" style="width: 650px">Oranje-Rood</li> <li class="oranje" style="width: 700px">Oranje</li> <li class="geel" style="width: 800px">Geel</li> <li class="groen" style="width: 700px">Groen</li> <li class="lichtgroen" style="width: 600px">Lichtgroen</li> <li class="groenblauw" style="width: 500px">Groen-Blauw</li> <li class="blauw" style="width: 400px">Blauw</li> </ul> </html> |
Grafiek met een as
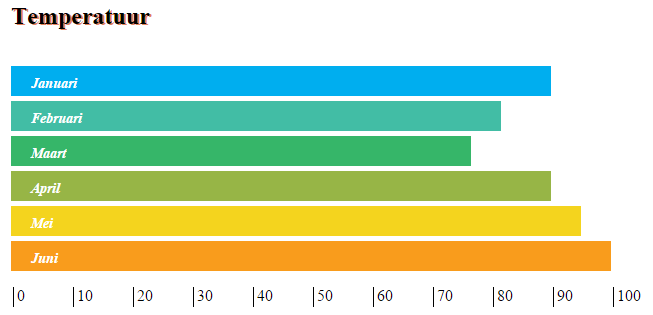
Ik had het idee om een as aan de Bar grafiek toe te voegen ik kwam deze tutorial tegen, ik heb hier en daar wat aanpassingen gemaakt:
Het CSS bestand (voor kleuren en vormgeving):
|
1 2 3 4 5 6 7 8 9 10 11 12 13 14 15 16 17 18 19 20 21 22 23 24 25 26 27 28 29 30 31 32 33 34 35 36 37 38 39 40 41 42 43 44 45 46 47 48 49 50 51 52 53 54 55 56 57 58 59 60 61 62 63 64 65 66 67 68 69 70 |
.bargraph { list-style: none; padding-top: 20px; width: 600px; } ul.bargraph li { height: 30px; color: white; text-align: left; font-style: italic; font-weight: bolder; font-size: 14px; line-height: 35px; padding: 0px 20px; margin-bottom: 5px; } span { position: absolute; display: block; height: 20px; width: 1px; background: black; } h1 { font-size: 150%; padding-left: 40px; text-shadow: 2px 1px #E28159; } ul.bargraph li.dieprood { background: #ED1C24; } ul.bargraph li.roodroze { background: #EF465B; } ul.bargraph li.roze { background: #E55A6B; } ul.bargraph li.oranjerood { background: #E28159; } ul.bargraph li.oranje { background: #F99C1C; } ul.bargraph li.geel { background: #F4D41E; } ul.bargraph li.groen { background: #97B546; } ul.bargraph li.lightgroen { background: #36B669; } ul.bargraph li.groenblauw { background: #42BDA5; } ul.bargraph li.blauw { background: #00AEEF; } |
Het HTML bestand:
|
1 2 3 4 5 6 7 8 9 10 11 12 13 14 15 16 17 18 19 20 21 22 23 24 25 |
<head> <link rel="stylesheet" type="text/css" href="CSS Bar voorbeeld 02.css"> </head> <html> <h1>Temperatuur</h1> <ul class="bargraph" style="width: 800px"> <li class="blauw" style="width: 500px">Januari</li> <li class="groenblauw" style="width: 450px">Februari</li> <li class="lightgroen" style="width: 420px">Maart</li> <li class="groen" style="width: 500px">April</li> <li class="geel" style="width: 530px">Mei</li> <li class="oranje" style="width: 560px">Juni</li> </ul> <span style="left: 50px"> 0</span> <span style="left: 110px" > 10</span> <span style="left: 170px" > 20</span> <span style="left: 230px" > 30</span> <span style="left: 290px" > 40</span> <span style="left: 350px" > 50</span> <span style="left: 410px" > 60</span> <span style="left: 470px" > 70</span> <span style="left: 530px" > 80</span> <span style="left: 590px" > 90</span> <span style="left: 650px" > 100</span> </html> |
[#/scripts/css_bar_grafiek” ]


