Grafieken – Highcharts (software)
Informatie (ENG)
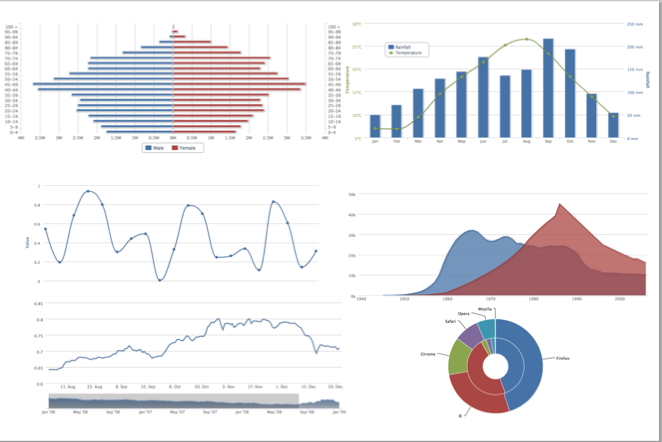
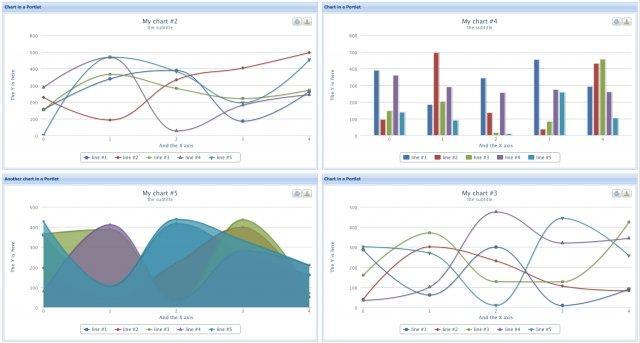
Highcharts is a charting library written in pure javascript, offering an easy way of adding interactive charts to your web site or web application. Highcharts currently supports many chart types, including line, spline, area, areaspline, column, bar, pie, scatter, bubble, gauge and polar chart types (for a full list, see below). Many of the chart types can be combined in one chart. Users can export the chart to PNG, JPG, PDF or SVG format at the click of a button, or print the chart directly from the web page.
It works in all modern browsers including the iPhone/iPad and Internet Explorer from version 6. Standard browsers use SVG for the graphics rendering. In legacy Internet Explorer graphics are drawn using VML.
One of the key features of Highcharts is that under any of the licenses, free or not, you are allowed to download the source code and make your own edits. This allows for personal modifications and a great flexibility.
Highcharts is solely based on native browser technologies and doesn’t require client side plugins like Flash or Java. Furthermore you don’t need to install anything on your server. No PHP or ASP.NET. Highcharts needs only two JS files to run: The highcharts.js core and either the jQuery, MooTools or Prototype framework. One of these frameworks is most likely already in use in your web page.
Setting the Highcharts configuration options requires no special programming skills. The options are given in a JavaScript object notation structure, which is basically a set of keys and values connected by colons, separated by commas and grouped by curly brackets.
Supported Chart Types Include:
- Line and Spline
- Area and Area-range
- Area-spline and Spark-line
- Column, Column-range and Bar
- Pie and Donut
- Combination(s) of Column, Line and Pie
- Scatter and Bubble
- Dynamic and Master-detail
- 3D and Meteogram
- Angular Gauge and VU Meter
- Clock
- Heat Map
- Polar chart
- Spiderweb
- Wind rose
- Box plot
- Error bar
- Waterfall
- Funnel and Pyramid chart(s)
- General drawing