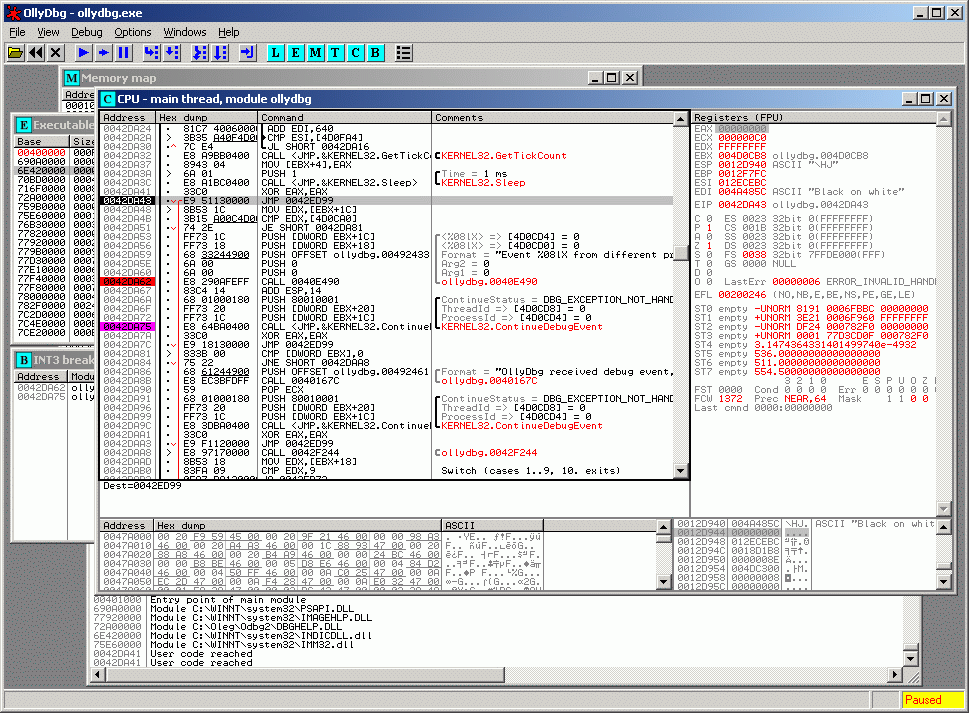
Windows Debugger – OllyDbg (software)
Informatie (ENG):
OllyDbg is a 32-bit assembler level analysing debugger for Microsoft® Windows®. Emphasis on binary code analysis makes it particularly useful in cases where source is unavailable. OllyDbg is a shareware, but you can download and use it for free. Special highlights are:
- Intuitive user interface, no cryptical commands
- Code analysis – traces registers, recognizes procedures, loops, API calls, switches, tables, constants and strings
- Directly loads and debugs DLLs
- Object file scanning – locates routines from object files and libraries
- Allows for user-defined labels, comments and function descriptions
- Understands debugging information in Borland® format
- Saves patches between sessions, writes them back to executable file and updates fixups
- Open architecture – many third-party plugins are available
- No installation – no trash in registry or system directories
- Debugs multithread applications
- Attaches to running programs
- Configurable disassembler, supports both MASM and IDEAL formats
- MMX, 3DNow! and SSE data types and instructions, including Athlon extensions
- Full UNICODE support
- Dynamically recognizes ASCII and UNICODE strings – also in Delphi format!
- Recognizes complex code constructs, like call to jump to procedure
- Decodes calls to more than 1900 standard API and 400 C functions
- Gives context-sensitive help on API functions from external help file
- Sets conditional, logging, memory and hardware breakpoints
- Traces program execution, logs arguments of known functions
- Shows fixups
- Dynamically traces stack frames
- Searches for imprecise commands and masked binary sequences
- Searches whole allocated memory
- Finds references to constant or address range
- Examines and modifies memory, sets breakpoints and pauses program on-the-fly
- Assembles commands into the shortest binary form
- Starts from the floppy disk
and much, much more!
OllyBonE
OllyBonE takes advantage of the split TLB architecture of Intel processors to protect memory pages from execution but still allow read/write access.
Basically OllyBonE consists of a Windows kernel driver that implements the page protection for arbitrary memory pages, and an OllyDbg plugin that communicates with the driver. When the protected page is accessed by the CPU for execution, the INT1 handler is called, returning control to OllyDbg.
The normal method of use is to load a packed program, making note of which section in the memory map will be executing when the unpacking is finished, then setting the break-on-execute flag for that section. This loads the kernel driver into memory and protects the desired physical memory pages from being executed. (Note that only one instance of OllyDbg can use the kernel driver at a time, if you try to load a second instance, you will get an error message “Kernel driver load returned status 5”). When the program is run, OllyDbg will (hopefully) break on the first instruction, which would be our original entry point (OEP).
This technique generally only works with packers that append their unpacking code as a stub section to the PE file, then restore the unpacked code into its original sections. In many cases, packers may employ anti-debugging tricks during the execution of the stub code, which must still be worked around. OllyBonE isn’t going to work in all cases, but it can be a shortcut for quickly unpacking the most common packer code.
Installing OllyBonE
- Unzip and copy ollybone.dll and i386/ollybone.sys to your OllyDbg directory
- Your memory map right-click menu should now have the option “Set break-on-execute”. Ensure that the checkbox in Debugging options->Exceptions for ignoring the Single-step break is *unchecked*, otherwise the INT1 handler will not return control to the debugger.
Example: UPX
Let’s look at an app packed by UPX. In the OllyDbg memory map window, we see:
|
1 2 3 4 |
00400000 00001000 test 0 PE header Imag R RWE 00401000 00040000 test 0 UPX0 Imag R RWE 00441000 0002A000 test 0 UPX1 code Imag R RWE 0046B000 00001000 test 0 .rsrc data,imports Imag R RWE |
Our entrypoint in this program is at 0046A350, which is in the UPX1 section. If you’ve ever manually unpacked a UPX program before, you know that typically the stub code in UPX1 will unpack the real program code to the UPX0 section, before jumping to it at the bottom of the stub code. So, we select the UPX0 section in the memory map window, choose “Set break-on-execute”, and then run the program by hitting the “play” button or F9.
OllyDbg then stops due to a single-step break at the OEP, the first instruction executed in the protected UPX0 section. We are unpacked and can now analyze the program or dump it using OllyDump.
Download ollybone @ joestewart.org
[#/software/ollydbg” ]


